smart solution solves the problem of AVERAGE math subjects
Good night Mr maternal mathematics
mathematician who is surfing looking for a quick way to solve the problem of
the average frequency distribution. Mathematics problems concerning the average
problem does have its own challenges for students. There are those who think it
is also difficult to solve the problem that contains the average problem with
the distribution of frequency tables. For students with the ability to
calculate the good multiplication and meticulous it is not a problem but for
those of you who have the ability to count that is not too good sometimes
because the lack of telitian causes an incorrect count until the correct answer
was not also obtained. Especially if you're grappling with the national exam
that is almost always present every year adorn the test paper.
Consider the tips to be true in working
out the matter of the average frequency distribution
1. Always improve student's simple
counting skills.
2. Diligently facilitate the child to
practice about the average frequency distribution to improve the accuracy of
the calculation
3. Help students to have confidence
while working on the problem. This is so that children can focus on working on
the problem, not depend on other friends.
4. Find a lot of references on how to
quickly work out the question of the average form of frequency distribution.
Well
of the four tips above admin will tangent item no 4 that is how to quickly work
out the matter of the average form of frequency distribution. The fast way here
does not mean there is a special formula inside but only simplifies the
calculation into smaller calculations. This will really help you not to get
caught in a miscalculation.
Consider the following reviews.
Notice the table below.
Nilai
|
50
|
60
|
70
|
80
|
90
|
Frekuensi
|
2
|
4
|
x
|
6
|
3
|
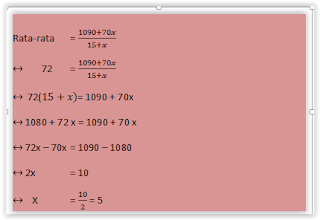
The table above shows the data of mathematical repetition value of a group of students. If the average
value of the data is 72 then many students who score below the average value are ....
A. 11
B. 10
C. 9
D. 6
Method 1
If done the usual way using a table like the following
the results obtained the same that students who get 70 is 5 people. So that got a score
below the average 72 as many as 11 students


The calculation of the second way is fewer, fewer steps, fewer numbers. With such an
assumption it will make the students more easily understand and solve the problem of
the average form of frequency distribution table.

No comments:
Post a Comment